Implementation record of SPLYZA Motion :
Tokushima Bunri University

Professor Osada, Department of Physical Therapy, Faculty of Health and Welfare, Tokushima Bunri University
■ Challenges Before Introduction
Previously, I was using free motion analysis software. However, these tools could basically only handle 2D
coordinate data, which limited my ability to perform 3D motion analysis. My biggest issues were "the amount
of effort" and "low accuracy." I had to manually calculate and correct coordinates from 2D video data, which
took an enormous amount of time for analysis.
■ Deciding Factors for Introduction
The biggest deciding factor was the ability to "complete measurements without markers and using just a
smartphone."
While my university lab has expensive equipment, the barrier for clinical staff to use specialized equipment
or to apply markers to the body in a hospital setting is too high. SPLYZA Motion, on the other hand, is
appealing because you can just record with a smartphone, instantly view a graph, and clinical staff can use
it intuitively.
It was also important that it allowed for "data processing and output in Excel," similar to what I had been
doing with specialized 3D motion analysis systems. Since data like positional changes and joint angles can
be exported in CSV format, I determined that I could directly apply my existing research methods (such as
secondary processing in Excel).
The fact that it can be introduced affordably through a subscription, compared to dedicated equipment
costing millions of yen, was also a major push for its adoption in budget-limited clinical settings.
■ Actual Utilization / Use Cases
I primarily utilize it for research purposes, specifically for the motion analysis of stroke hemiplegia
patients.
Specifically, I measure how their movement changes over time when a particular intervention is applied
(e.g., presence or absence of vibration stimulation, changing the type of cane or orthosis).
- Frontal Plane (Anterior View): Hip adduction angle, spinal lateral flexion angle
- Sagittal Plane (Lateral View): Hip and knee flexion/extension angles, trunk flexion/extension angles, angular velocity
I analyze using these indicators, currently focusing mainly on joint angles and angular velocity. It is also
a valuable measurement tool for external locations (such as sports fields and high schools) where I cannot
transport the large equipment from the university.
■ Changes After Introducing SPLYZA Motion
Clinical therapists have expressed great satisfaction, stating that they can now "prove numerically the
changes they previously grasped intuitively." Before, I largely relied on the clinical intuition ("gut
feeling") of therapists—things like "the trunk seems a little bent" or "movement has improved"—but now I can
objectively demonstrate this with graphs and numerical values.
Being able to evaluate the "quality" of
movement, not just walking speed, has been a significant change. Furthermore, compared to the time I spent
on manual analysis, the time saved has been dramatic, making preparations for research and case
presentations much smoother.
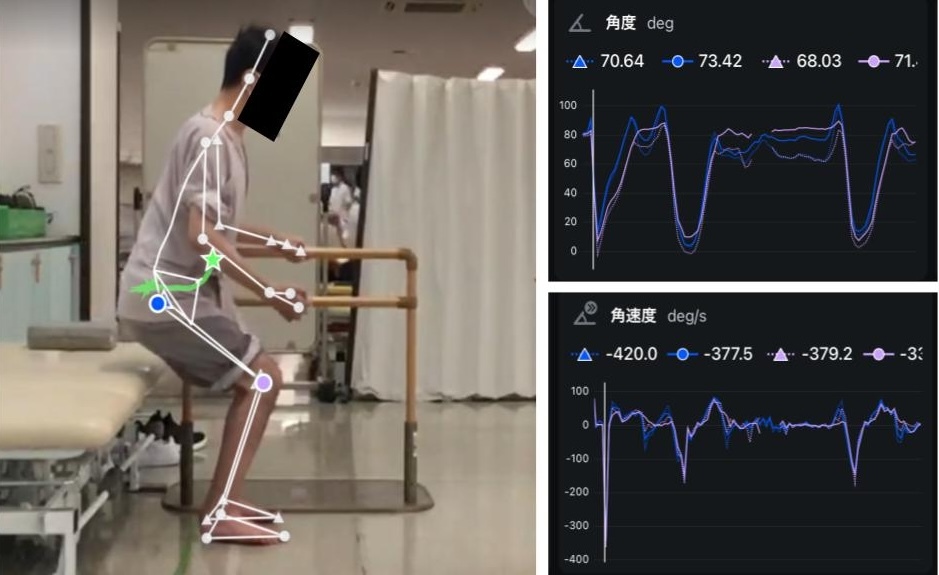
Effect of Different Frequencies of Vibration Stimulation on Sit-to-Stand Motion in Hemiplegic Patients
◯Yuro Osada¹), Jun Ikeuchi²), Masanori Enomoto²), Asuka Amaha²)
¹) Tokushima Bunri University, ²) Taoka Hospital, Tokushima Prefectural Physical Therapy Association
(2025)
*SPLYZA Motion 2D Mode
■ Future Outlook
In the future, I plan to expand the scope of utilization to include collaboration with local high schools
(for inquiry-based learning activities) and support for sports teams. For inquiry-based learning with high
school students, SPLYZA Motion allows them to visualize their body movements even if they don't understand
complex physics calculations, which has kept the students interested and engaged.
Regarding functional
improvements, I hope that enhancing the feature to automatically segment specific phases (like "stand-up" or
"gait cycle") from the measurement data and quickly display the maximum, minimum, and average values for
those sections will make analysis even easier.